
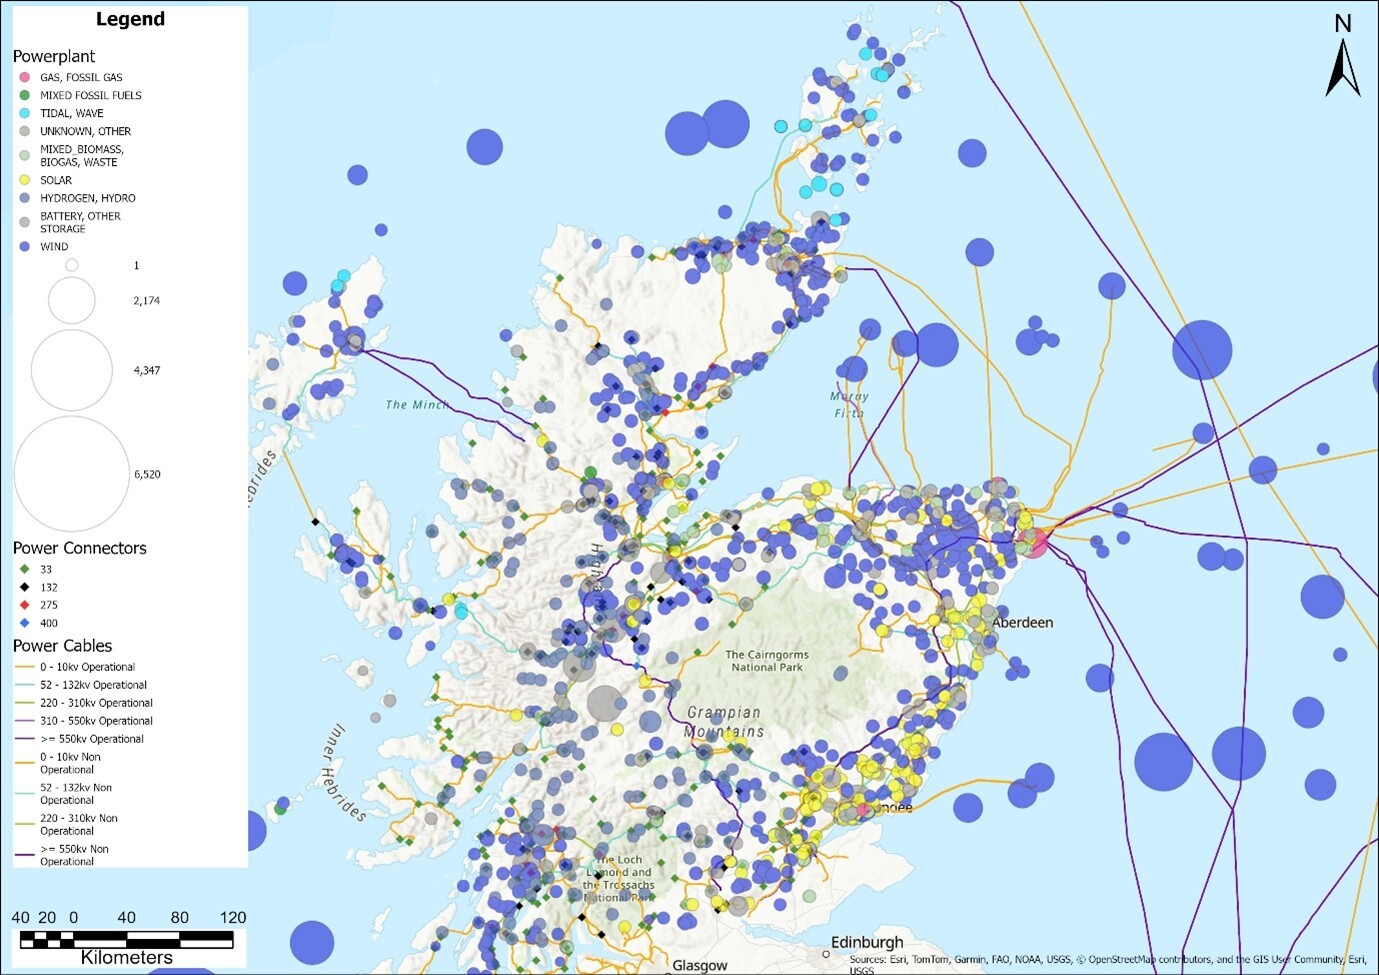
The map above offers a detailed overview of the energy infrastructure in the northern regions of Scotland, showcasing the distribution of power plants, power connectors, and power cables. The size of each power plant symbol represents its capacity, with varying energy sources including fossil fuels, wind, solar, and other renewables. Additionally, the map highlights the operational status and voltage levels of power connectors and cables, providing key insights into the region's energy landscape and its transition towards more sustainable and resilient energy solutions.
Struggling with siloed energy data or laborious manual workflows?
MapStand’s integration with ArcGIS Online tackles these challenges by delivering advanced geospatial energy intelligence in a single, seamless platform. By bringing its rich, global energy datasets into ArcGIS Online (AGOL), MapStand aligns with the world’s leading GIS platform—delivering added value to clients in oil & gas, renewables, research, and consulting. This collaboration offers both strategic and technical advantages, from advanced visualisation and analysis to broader reach and frictionless integration into existing GIS workflows.
Building on a Strong Geospatial Foundation
MapStand specializes in geospatial research for the global energy sector, offering up-to-date data on power generation, transmission networks, oil and gas infrastructure (upstream to downstream), and emerging decarbonisation technologies like hydrogen and CCUS. This data is made available via interactive maps, dashboards, and OGC (WMS/WFS) web services, which allow clients to stream content directly into their GIS systems without cumbersome data handling.
With many clients already using Esri tools to plan pipelines, site renewable projects, and assess assets, the ArcGIS Online partnership ensures MapStand’s data integrates effortlessly into existing workflows—extending accessibility through a platform clients know and trust.
New Capabilities with ArcGIS Online
1. Enhanced Mapping & Visualisation
ArcGIS Online brings MapStand data to life with smart symbology, high-resolution basemaps, and 3D visualisations. Users can explore global infrastructure layers, such as pipelines or wind farms, interactively in Map Viewer or Dashboards—combining realtime maps with key performance metrics.
2. Powerful Spatial Analysis
With AGOL, users can go beyond static maps. Built-in tools support analyses such as proximity checks (e.g. nearest grid connection), density mapping (e.g. clustering of solar farms), and terrain-based routing. These capabilities allow clients to unlock trends and insights without needing desktop software—AGOL’s cloud handles it all.
3. Seamless Collaboration
ArcGIS Online simplifies sharing. Clients can publish live maps and dashboards using MapStand data and share them internally, with stakeholders, or embed them in portals. Group access and permission control ensure secure collaboration, supporting everything from project planning to public engagement.
4. Enterprise Integration
Organizations using ArcGIS Enterprise can synchronize MapStand-hosted layers from AGOL into their private environments via Esri’s distributed collaboration tools. This enables internal teams to consume MapStand data within secure, governed systems—while ArcGIS Pro users can bring it directly into advanced workflows or offline analysis.
5. Performance & Scalability
Esri’s infrastructure offers speed and reliability. Whether viewing MapStand data at a national or global scale, ArcGIS Online delivers fast load times and smooth interaction, even for detailed datasets. Vector tiles, hosted feature layers, and optimized OGC formats ensure performance at scale.
6. Automated Updates
Through automation tools and scripts, MapStand can push regular updates to ArcGIS Online layers. Clients benefit from realtime data refreshes, always working with the most current infrastructure insights—whether for new projects, updates, or market changes.
 A screenshot from the “Clean Power 2030 Strategic Alignment” dashboard, showing zonal capacity and risk status across the UK by distribution/transmission connections. The top-right filters allow switching between solar, battery, and wind data, enabling a clear comparison of project stages and potential capacity.
Client Value: A Seamless GIS Experience
For MapStand’s existing clients, this integration brings greater convenience and efficiency. Rather than configuring WMS/WFS manually, Esri users can now access hosted feature layers directly in their ArcGIS environments. Dashboards, web maps, or layers can be embedded into client portals or shared instantly with decision-makers—streamlining the delivery of interactive, up-to-date content.
For prospective clients already invested in the Esri ecosystem, the partnership signals trust and compatibility. MapStand’s content is now “Esri-ready,” requiring no new platforms, minimal training, and little setup. Whether it's a renewable developer, oil major, or government analyst, the data is available where they need it—within their familiar GIS tools.
Strategic Impact of the Esri Partnership
Increased Visibility & Market Reach
As an Esri partner, MapStand gains exposure on Esri’s partner directory and potentially in the ArcGIS Marketplace. This opens the door to new clients actively seeking spatial energy data and apps—driving organic growth through Esri’s marketing engine.
Enhanced Credibility
Becoming an Esri partner validates MapStand’s technical capabilities. It shows alignment with Esri’s standards and reassures enterprise clients that the platform is secure, reliable, and future-proof. Early access to Esri’s updates allows MapStand to innovate faster and deliver the latest GIS capabilities to users.
Community & Collaboration
The partnership enables MapStand to connect with Esri’s user and partner community—creating opportunities for joint solutions, co-developments, and knowledge-sharing. Whether through conference presentations, joint proposals, or collaborative apps, this strengthens MapStand’s position in the energy and GIS sectors alike.
Use Cases Across Industries
Oil & Gas
Exploration teams can overlay MapStand’s well and pipeline data in ArcGIS Pro to assess nearby activity, plan drilling, and evaluate environmental constraints—all from one environment. Operational dashboards can track infrastructure in real time, combining MapStand layers with internal performance data.
Renewables & Power
Developers use AGOL apps powered by MapStand’s transmission and site data to assess grid access, proximity to substations, and land constraints—enhancing site selection and feasibility analysis. Utilities can benchmark infrastructure worldwide and visualise new projects in 3D.
Research & Academia
Researchers access MapStand data via ArcGIS Online to analyse energy transition trends or infrastructure resilience. They can combine it with open datasets and present findings through StoryMaps or interactive dashboards—making complex energy topics more accessible and shareable.
Consulting
Advisory firms deliver client dashboards with MapStand layers embedded—tracking route scenarios, proximity analysis, or market risks. These dynamic, map-driven reports enhance transparency, boost client engagement, and streamline project delivery.
An exciting collaboration ahead
MapStand’s integration with ArcGIS Online elevates its geospatial offering—unifying rich global energy data with Esri’s powerful GIS tools. For clients, the benefits are clear: faster insights, seamless access, and more informed decisions—all within their trusted ArcGIS environments.
This partnership enhances technical workflows and opens strategic pathways—from deeper market visibility to cross-industry collaboration. Whether supporting oil exploration, renewable planning, academic research, or consultancy services, MapStand + Esri delivers a flexible, future-ready GIS solution for the energy sector.
As the world moves toward a more connected and decarbonised future, this collaboration is a significant step forward—empowering organisations to map smarter, plan better, and lead with confidence.
Interested in unlocking the power of MapStand’s data within ArcGIS Online?
Get in touch today for more information or to request a personalised demonstration and discover how MapStand can enhance your GIS workflows.
A screenshot of SSE’s Transmission Heatmap, displaying colour-coded power plants, power connectors, power cables, substations, and service areas across SSE’s network. Filters enable users to refine which assets are shown, while the timeline slider at the bottom illustrates how infrastructure evolves from 2000 to 2030.